Improving the performance of your webpage shouldn't be a one-time task. Performance budgets help you to make sure that your page stays fast, even after more features get added.
When I was new to this topic I had to do quite some research until I felt like I had a good grasp of what all of this means. What's the difference between synthetic testing and RUM? What kind of tools can I use? How do I explain to other people that performance is important?
In this article, I'll try to help you with these questions and give you an introduction to performance budgets, the metrics and tools you can use and how you can implement them in your company.
What is a performance budget?
A performance budget is a limit you set on certain metrics that the team is not allowed to exceed. It usually measures the size of your different build-files but you can include many other metrics as well that are closer to the user experience.
How to get your company on board
A performance budget is relevant to more people than just the developers. You could get leaders from your company on board by showing them how improving performance directly correlates to making more money. Comparing your website's performance to competitors is also a good way to gain more interest in this topic.
Adjust how you explain this to each stakeholder based on what matters most to them. Tammy Everts explains how to do this in her talk.
Metrics
Tim Kadlec found out that performance budget metrics can be grouped into a few sets. A good combination of all of them will give you a better picture of the performance of your page. Here I took a few metrics per group as examples but of course, this isn't a comprehensive list.
Quantity based metrics
They include metrics that measure the bundle size of JavaScript or the number of HTTP requests. They are easy to monitor but they don't give us a good picture of the user experience.
Milestone timings
Here we can find metrics like Time to Interactive, Time to Render or domContentLoaded. As the name already says, they measure time, that's why they should run either in a synthetic environment or as a RUM (Real User Measurements). Keep in mind that they vary depending on the network connectivity of the end-device.
Also included in this category are custom metrics that measure the time passed until an important bit of data appears on the screen (like Twitter's Time to First Tweet).
Rule-based metrics
Tools like WebPageTest or Lighthouse also provide a single number that combines multiple metrics in one. This score grades the overall performance of your site.
Where to measure
In The 4 Disciplines of Execution (4DX), Chris McChesney talks about the difference between lead and lag measures for measuring the performance of a business. I think it's a good way to look at metrics that measure webpage performance as well.
Lag measures are what you are ultimately trying to improve, like for instance customer satisfaction or in our case performance, while lead measures measure the behavior that will drive success in the lag measures. Lead measures are easier to act upon because they give you immediate feedback. They will have a positive impact on the long-term goals defined by the lag measures.
We can use this terminology for our case as well and differentiate between metrics that are driving behavior (feedback during development) and metrics that give us feedback after we deployed what we developed (regression).
Synthetic testing
Synthetic testing collects metrics from a controlled lab environment. This means that the client-side variables like device and network settings are fixed. You can run these tests against your production system, but results might vary depending on the load on your server, so it's best to run them on a local server or have a dedicated testing system.
Going back to the analogy of the 4DX, testing like that would result in lead measures since they happen during development and thus drive behavior.
This kind of testing is good for performance budgeting and finding bottlenecks in your application.
Real User Measurements (RUM)
These measurements test the experience of real-world users. They can correlate to business key performance indicators (KPIs), so they make it easier for non-technical people to understand the importance of improving performance.
These measures fall into the category of lag measures. Ultimately, we try to improve the experience of real-world users but by the time we get this data, it's already too late.
You can't use all metrics for RUM and this kind of testing can't be used for performance budgeting. Nevertheless, it's important to have these metrics as well since they give you better insights into real-world scenarios and they might uncover some bottlenecks that synthetic tests didn't cover.
How to measure
Now you have decided on what metrics you want to start measuring. But how do you go about deciding what tool to use?
Some tools allow you to analyze your page manually. They are good for identifying bottlenecks but not so good for enforcing a performance budget. You shouldn't rely on developers testing the performance reguarly.
Here I'll list some tools you can use for synthetic testing and performance budgeting. All of them are open source and free of charge.
bundlesize
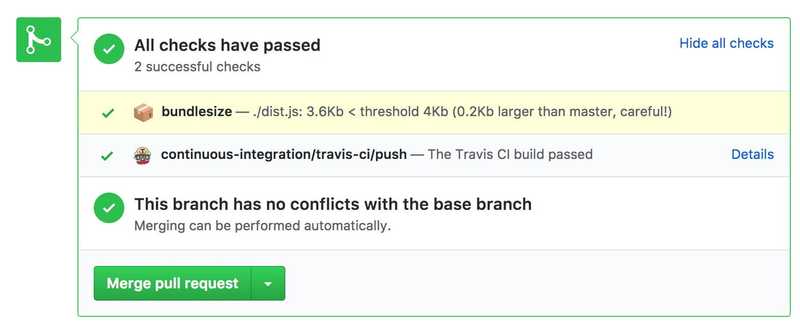
Using the npm package bundlesize is a good way to get started with performance budgeting. It measures the size of your JavaScript bundles, images and every other file that your build process is producing. It integrates nicely into your CI pipeline and GitHub and allows you to prevent the application from becoming too big.
You can add this to your project in a matter of minutes.

However, only measuring the bundle size is far from giving you the complete picture of your site's performance.
The following tools have a lot more features but are also harder to set up:
Lighthouse CI
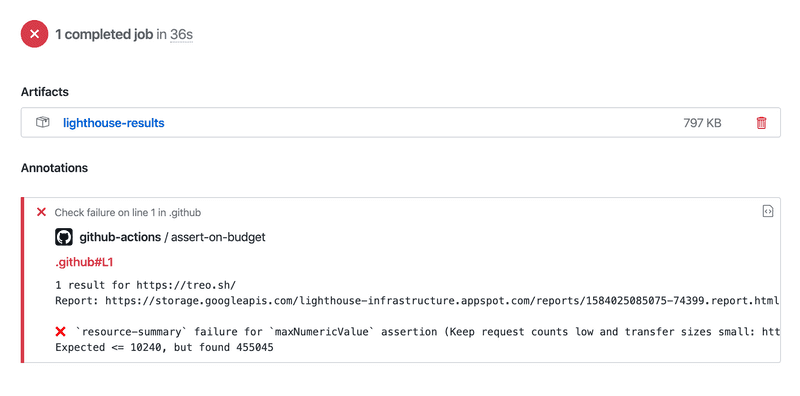
This set of tools gives you all the metrics Lighthouse already offers and lets you integrate them into your CI pipeline. It lets you set performance budgets and you can let pull requests fail when certain thresholds aren't met.

Lighthouse CI consists of two tools:
- The node CLI runs Lighthouse, asserts results, and uploads reports.
- The node server stores results, compares reports, and displays historical results with a dashboard UI.
If you have a web-application that requires to be run on a server you can start the server before the Lighthouse CLI runs
by adding an npm script
with the name serve:lhci to your package.json file.
Check it out by yourself here.
sitespeed.io
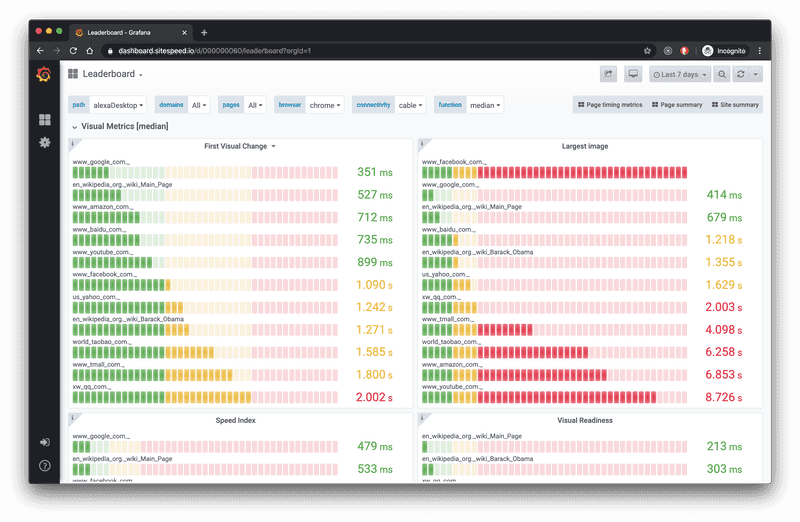
Sitespeed offers, just like Lighthouse, a set of tools, but with more customizability and features. You can create your own dashboard for keeping track of your metrics and compare them to your competitors. It also integrates into your CI pipeline and you can break the build depending on the thresholds you set in your performance budget.

They describe their main use-cases like the following:
- Running in your continuous integration to find web performance regressions early: on commits or when you move code to your test environment
- Monitoring your performance in production, alerting on regressions.
Here's the link to the documentation.
...and more
There are more paid (Speedcurve for example) and open-source tools that you can use to create a performance budget. WebPageTest also has an API that you can use in your CI pipeline.
I encourage you to read the documentation about the tools I mentioned above and see what suites your needs the best.
What should your performance budget be?
You can start by using the worst value of the last weeks. This will be the limit that you're not allowed to exceed.
Review your performance metrics at least every couple of weeks to see if something changed. If you improved performance, adjust the budget to be lower. If your performance has gotten worse, start working on getting it back to where it was before.
It's also a good idea to compare your metrics to your competitors and see where you stand. If you want to be noticeable faster, your goal should be to be at least 20% faster.
Conclusion
I hope I could give you a good initial overview of what performance budgeting is and how you can start implementing it in your company.
You can start with a simple setup that includes monitoring some of the most important metrics. From there you expand it as you gain more knowledge about which metrics matter the most to your project.
Other articles you might find interesting:
